 |
Back to Homepage & Index |
This Page - A Homemade Lecher Line for the Indication of UHF and Microwave Wavelengths |
| The author has had a lifelong interest in the radio control of model aircraft which has spanned the years from when one not only built the model but one often built the vhf.radio equipment as well, until the present day and the current use of sophisticated uhf.gear operating at 2.4GHz. |
Until the early years of the current century, radio-controlled model aircraft operated on frequencies of 27MHz and 35MHz in the United Kingdom for which it was possible to construct regulation compliant transmitters and receivers using ad hoc. microcircuits and discrete components. In fact the originator of the shared Norcim site, Terry Tippet, marketed kits for home construction until 2000. |
The Lecher Line
If an oscillator is produced it will be essential to have something to indicate the operating frequency and a Lecher Line presents a simple method of doing this.
Like so many things to do with high frequency generation and measurement, foundation work was undertaken much earlier than one might imagine. Ernst Lecher developed his apparatus in 1888.
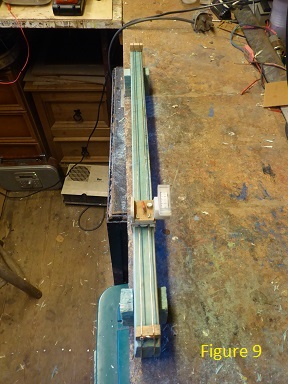
My line, shown in Figure 1, is constructed on a 25mm x 40mm batten 1100mm long.
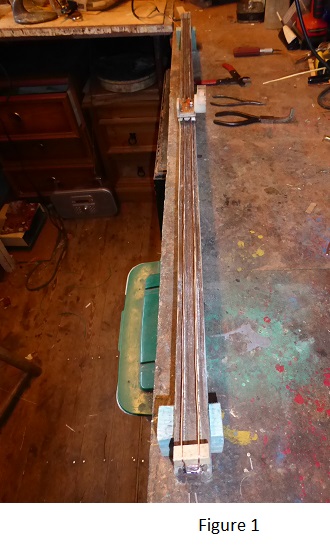
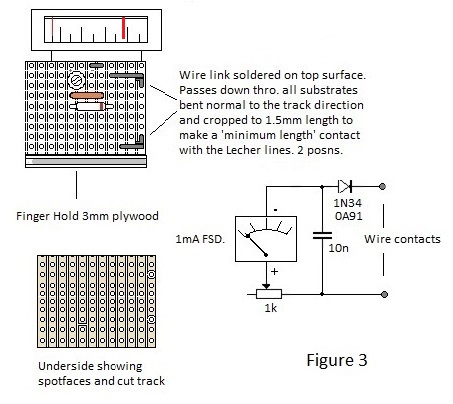
The line comprises parallel one square mm cross section copper wires stripped from lighting cable, spaced 12mm apart and 12mm above the batten; the lines being tightened by improvised turnkeys which are screwed into the underside of the batten as shown in Figure 2. Mechanical stabillity of the line is enhanced by a hardwood spacer block half way down the line which is glued in place after the wires have been tightened. The block is grooved slightly to locate the wires and the undersides of the wires are epoxied onto the grooves. Once the glues have cured, the block is 'sculpted' to a depth of 8mm with a Dremel rotary saw or similar so that the wires rest on ribs of width equal to the wire thickness. This facilitates the unimpeded passage of the sliding detector assembly detailed in Figures 3 & 4.
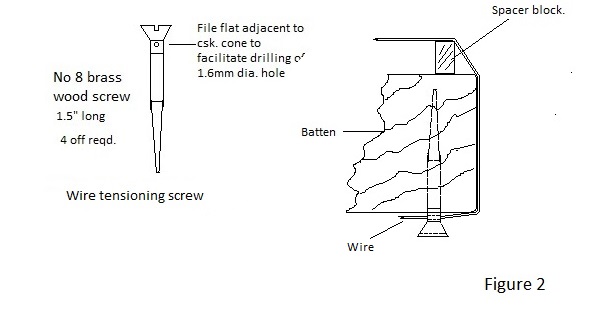
A Silicon Schottky diode may be used but a Germanium signal diode is better for small signals.
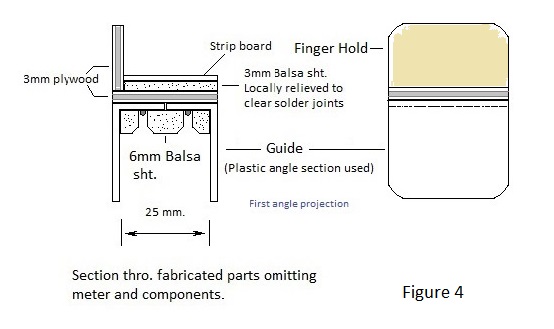
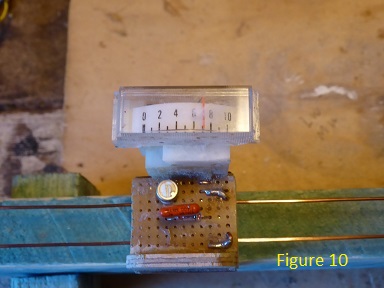
The circuit is constructed on a small piece of stripboard which is mounted on a sliding carriage with point contacts to the line conductors as detailed in Figure 4. The meter movement used has been salvaged from an old radio control transmitter but similar devices are readily available as battery state indicators.
Should it be difficult to obtain a suitable small meter the alternative current peak detection method might be more convenient. In this case the end of the line is left open and the detector is removed from the sliding carriage and replaced simply by a bar which short circuits the lines. A static detector circuit is inductively coupled by an insulated wire loop surrounding the signal input wires where they connect to the line.
Some amplification might be necessary with a static detector, for which the arrangement depicted in Page 22 of the norcim site is is ideal. For operation solely at 2.4 GHz an improved version shown on page 27 of the site is even better.
A problem with making something from materials to hand is that it is difficult for anyone else to replicate it exactly. Being involved with model arcraft, I have balsa and plywood to hand but other materials such as Paxolin or MDF. might be employed equally well.
With the suspended line the measured inter-peak distance is 300mm which corresponds with the half wavelength for 500Mhz. in air. Although the line contacts are spaced 3mm from the leading edge of the carriage, this is immaterial, and the leading edge of the carriage provides the most convenient datum for measurement. Marking the batten with a pen soon gets messy and leads to confusion. A short strip of insulation tape across the batten with its edge coincident with the leading edge of the carriage is a far better solution.
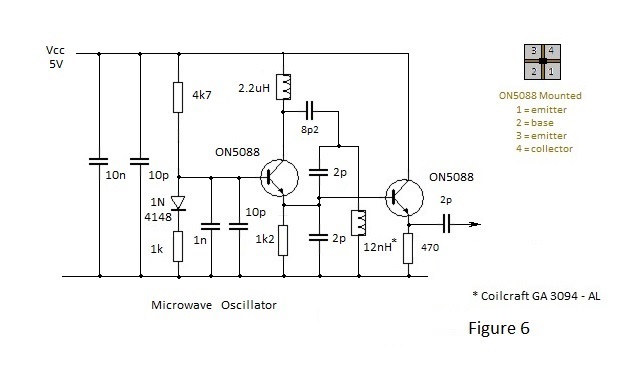
Now we arrive at the difficult problem (for the author at least) of mounting ON5088 transistors in a manner consistent with their use with stripboard. The ON5088 transistor is housed in four pin surface mount d.i.l. package which lends itself to mounting on cruciform isolated lands. Consequently a suitably sized grid pattern was scored through the copper surface of a piece of g.r.p. laminate such that the smt. transistors could be centred over the intersections. I found it relatively easy to manipulate the transistors into position but my chances of soldering them there were very slim. Clamping them was found to be impractical so it was decided to try to glue them in position prior to soldering their pads to the lands.
My first attempt involved putting a tiny spot of epoxy resin at the centre of a cross and to position the transistor appropriately; soldering pads to lands once the epoxy had cured. This was managed with difficulty because the heat of soldering softened the epoxy, allowing the transistor to move. Because of this I tried pva or white glue instead of epoxy.
It turned out to be a master stroke because, not only had the glue sufficient tack to retain the transistor while it was nudged into position, but it 'cured' immediately the soldering iron tip was placed on a land. Once cured the remaning package pads could be soldered to the lands without difficulty. It is a good idea to mark the land connected to the broad emitter terminal prior to soldering because the ON5088 transistor has a 'parasitic' diode between collector and emitter which can lead to confusion when the assembly is checked with an ohmmeter.
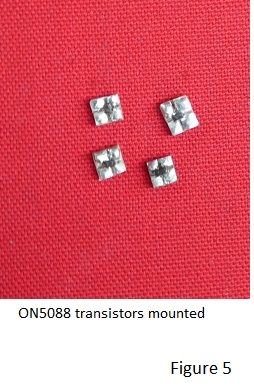
Four examples of ON5088 transistors, mounted by this process, are shown in Figure 5. It will be noticed that one of these is larger than the rest; this being the epoxied version which needed to be larger to avoid softening and movement during soldering.
Mounting the transistors on substrates permits their re-use in 'cut and try' experiments.
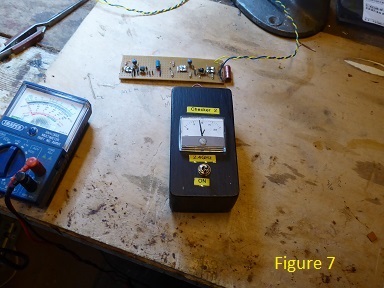
That the circuit oscillates is demonstrated in Figure 7 where the absorbtion wave meter described in Page 27 of the Norcim site and Page 16 of this site is shown with the apex of its aerial directed at the tuned circuit on a stripboard layout. The operating circuit embodies the components on the right of the layout. An oscillator without the emitter follower stage is laid out on the left hand side.
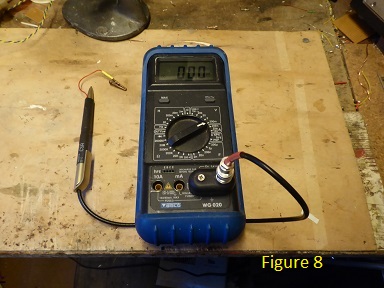
Having established that the oscillator is functional, its output was connected to the Lecher Line for wavelength measurement. It was found that the output was adequate for the Lecher Line detector but that measurement was rendered difficult by the presence of false peaks produced by radiated and reflected signals. Clearly what works well at 500MHz does not necessarily work a higher frequency and it was was apparent that a shorter line with screened input would need to be constructed. It was also apparent that that a home brewed rf. probe used for circuit point measurment, and shown in Figure 8 below, was not fit for purpose.
In view of the apparent rapid attenuation down the line exhibited when the detector carriage is employed it was decided to observe what happens with a detector coupled to the generator end of an open line in conjunction with a movable shorting bar. As a quick test, the wavemeter shown in Figure 7 was placed near the start of the line and a simple wire shorting link was moved along it. Although this crude set up is too unstable for accurate measurement, it demonstrated clearly that the apparent rapid attenuation down the line, observed with sliding detector carriage, appears to be a function of the detector itself.
With the fixed wavemeter detector the indication was observed to rise and fall as the shorting link moved along the line with peaks at approximately 65mm intervals, confirming a frequency of approximately 2.4GHz.
The probe and DMM assembly shown in Figure 8, with the input looped around the input to the line, was also used as a detector but the analogue wavemeter indication was found to be superior despite a greater susceptiblity to body reflections.
In order to reduce the uncertainty in measured wavelength, the positions of four contiguous dips were marked. These spanned a total of 190mm which indicated an inter dip distance of 190/3 = 63.33mm.
Thus the measured line wavelength is approximately 126.7mm which corresponds to a frequency of 2.37GHz.; a very convenient result!
Of course it is possible that the actual frequency is slightly lower than this, coupled with transmission down the line of less than the speed of light. However the results demonstrate clearly that it is practicable for the 'shed experimenter' to make a microwave generator without specialised equipment and that a reasonably close approximation to the wavelength of the generated signal can be obtained using a simple Lecher Line.
For a description of the embodiement of a Lecher line in a valve oscillator circuit please visit Page 24 or Page39 of the Norcim site which is also under development.
Further development
The line as described in the foregoing text was adequate for the experiment described but it was not suited to general purpose use, particularly with respect to the maintenance of line tension; the wood screw based
tensioners be suitable only suitable for 'at the time' tensioning. It was decided therefore to provide spring tensioning with the object of providing a more stable arrangement for general use.
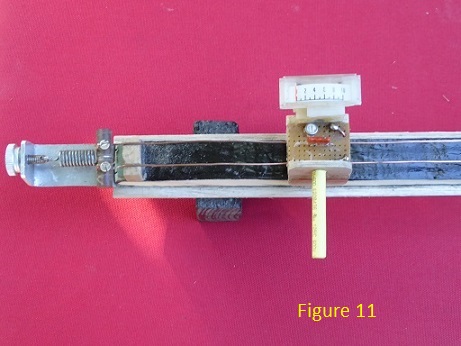
Ideally it would be better if each line has a separate tension spring but space limitation prevents this and consequently the arrangement depicted in Figure 11 was adopted.
In the arrangement both lines are terminated through holes in a Tufnol bar and clamped by 6BA screws which permit the line lengths to be matched. The centre of the bar is ringed by a groove which accommodates an end hook of a strong tension spring to provide a balanced 'T' arrangement.
The remote end of the spring is hooked through the end of a threaded rod which in conjunction with an extension bracket and a knurled nut facilates tensioning.
The mounted ON5088 transistors shown in Figure 5 are larger than necessary and consequently it was decided to mount further examples on a smaller carrier using the same method. These these can be seen installed in the test circuit assembly shown in Figure 12.
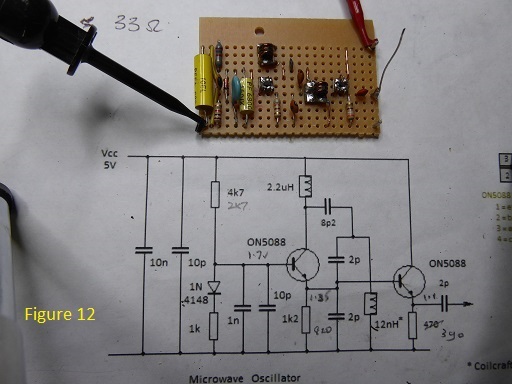
The assembly depicted in Figure 12 embodies two of the smaller assemblies and a Coilcraft coil is substituted for the 2.2uH bead inductor employed previously in the collector circuit of the oscillating transistor; the latter to assess its possible impact on output power.
The output with this modification did not appear to be significantly greater but it might possibly reduce band- width and accordingly it has been retained for further Lecher line experiments.
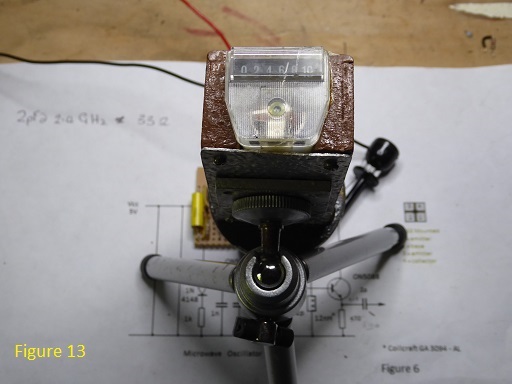
To demonstrate the output of the oscillator the response of a wavemeter with a helical aerial proportioned for 2.4GHz reception is shown in Figure 13.
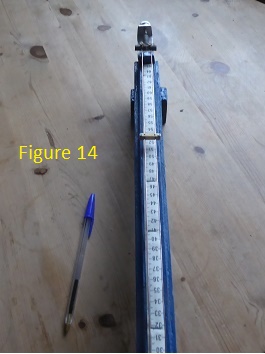
To tidy up the line and to complete its development, a centimetre scale was added as is shown in Figure 14
below. Also shown in the figure is the shorting bar which can be slid along the line and clamped in position as desired.
The reader might notice that the wooden chassis frame has been painted blue, the chosen colour for the author's ad.hoc. self-built test gear.
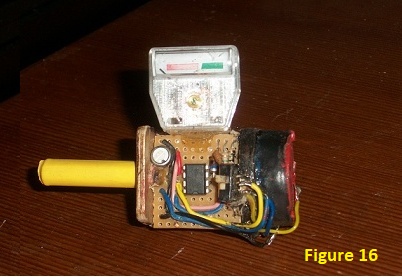
Undoubtedly the most convenient detector/indicator of the voltage peak and troughs along the line is a sliding pick-up arrangement something like that shown in Figures 3 and 4 above. However the device shown in those figures tends to load the line more than is desirable at microwave frequencies and it was decided to try an amplified version with input resistance of about 1MOhm and gain of approximately 10, the circuit schematic of which is shown in Figure 15 below.
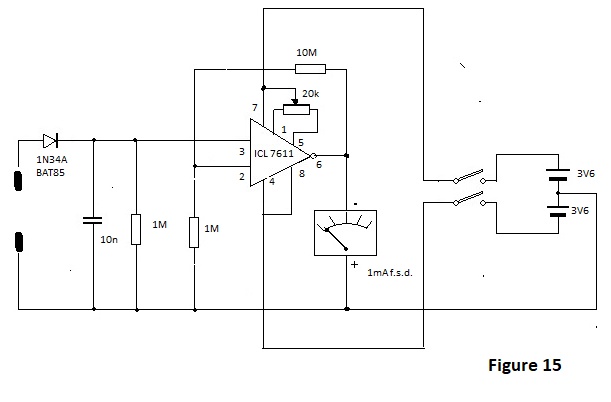
Figure 16 depicts the device cobbled up from avialable bits and pieces to effect an amplified detector circuit.
Whilst it would not be practicable for an interested reader to replicate the actual arrangement, Figure16, in conjunction with details shown in Figures 3 and 4, gives an idea of what is required.
Whilst the amplified detector shown in figures 15 and 16 operates as expected, it would benefit from a longer scaled and better damped moving coil meter movement, such as that as shown in Figure 10 above.
For an application of a Lecher line to an oscillator circuit, please visit Page 24 of this site or Page 39 of the Norcim site.
Page and project under development.
Thank you for reading thus far. All of the information is free to use.